---
# From Chaos to Clarity: Making Sense of Nginx Logs in the Browser
**URL:** https://modul-r.codekraft.it/from-chaos-to-clarity-making-sense-of-nginx-logs-in-the-browser/
Date: 2026-06-03
Author: Erik
Post Type: post
Summary: If you manage a server, you already know the truth about Nginx access logs: they are an absolute goldmine of information, but a complete nightmare to read. When you are actively trying to mitigate a Layer 7 DDoS attack or track down a botnet aggressively probing for vulnerabilities, staring at raw tail outputs is an […]
Categories: Blog
Featured Image: https://modul-r.codekraft.it/wp-content/uploads/2026/06/nginx-log-parser.png
---
If you manage a server, you already know the truth about Nginx access logs: they are an absolute goldmine of information, but a complete nightmare to read.
When you are actively trying to mitigate a Layer 7 DDoS attack or track down a botnet aggressively probing for vulnerabilities, staring at raw tail outputs is an exercise in frustration. The engine logs are dense, repetitive, and practically impossible to summarize at a glance. You need to know *who* is attacking, *what* they are looking for, and *where* they are coming from—and you usually need to know it five minutes ago.
That is exactly why I built the **Nginx Log Analyzer**.
I wanted a tool that strips away the noise and gives a clear, immediate vision of server activity without requiring complex backend setups or elastic stacks.
### How It Works
The core philosophy of the analyzer is simplicity and speed. You don't need to install any backend dependencies or pipe your logs to a third-party service. You simply open the tool, paste your raw Nginx access logs directly into the interface, and let the engine do the rest.
Here is what happens under the hood when you paste your logs:
#### 1. 100% Client-Side Processing
Because the tool is hosted statically on GitHub Pages, **zero log data ever leaves your machine**. All the parsing, regex matching, and grouping happen directly in your browser using JavaScript. Your server's sensitive access data remains completely private.
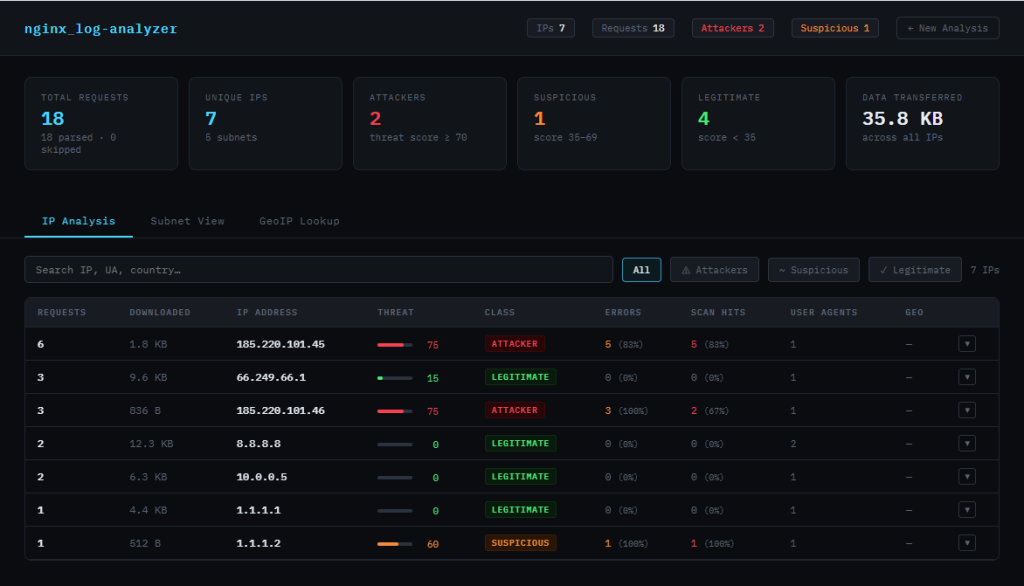
#### 2. Intelligent Threat Scoring
Not all traffic is created equal. The analyzer parses Combined and Common log formats and assigns a Threat Score (0–100) to every IP address. It classifies visitors as *Attacker*, *Suspicious*, or *Legitimate* by looking for specific red flags:
- **Scan Patterns:** It actively flags requests probing for known exploits, such as hidden `.env` files, `wp-login.php` spam, `xmlrpc` endpoints, or SQL injection attempts.
- **Error Rates:** It calculates the ratio of 400/500 level errors to total requests, quickly highlighting bots blindly guessing URLs.
- **Suspicious User-Agents:** It identifies known crawlers, vulnerability scanners (like Nikto or SQLMap), and requests missing a User-Agent entirely.
#### 3. Subnet Grouping
Attackers rarely use a single IP; they use botnets. To help you write effective firewall rules, the analyzer automatically groups IPs by their subnets (`/24` for IPv4 and `/48` for IPv6). If a coordinated attack is originating from a specific block, you will see it immediately and can ban the entire subnet rather than playing whack-a-mole with individual IPs.
### Try It Out
Whether you are auditing your traffic, hunting down a specific bug, or actively defending your infrastructure, having a clean, structured view of your logs changes the game.
You can test the tool directly in your browser right now:
[**Check out the Nginx Log Analyzer here**](https://erikyo.github.io/nginx-log-analyzer/)
Does this structure hit the right tone for your usual readers, or would you prefer to dive even deeper into the technical mechanics of the JavaScript regex and threat-scoring algorithms?
---
## Categories
- Blog
---
## Navigation
- [Modul*R](https://modul-r.codekraft.it/)
---
## Footer Links
- [WordPress](https://wordpress.org/)